Inherited Inequality
First published in Le Nouvelliste on 10 June 2026. Read on lenouvelliste.com ↗
Translated from the French original. In case of discrepancy, the French text prevails. Read the French original
Part of Haiti’s inequality is passed on before any individual has made a single decision: it is inherited. This column puts a figure on its scale and looks at what this fixed share makes possible, or impossible, for public policy.
LE NOUVELLISTE · A column by Réginald Surin
Inherited Inequality
Between a quarter and a half of the income gap between two Haitians is decided at birth
What the numbers do to the narratives through which Haiti makes its inequality bearable
Two young men, the same age. One is born in Pétion-Ville, the son of a civil servant, in a house with books and electricity almost every evening. The other is born in Bombardopolis, the son of a farmer, in a house with a kerosene lamp and a field that depends on the rain. Thirty years later, the first earns, say, ten times what the second does. The figure is set down here purely for illustration, and the data in this piece will show that it is, if anything, cautious. How much of this gap comes from the effort each of these young men has put in? And how much is owed to what was left to them, or bequeathed to them, at birth?
Every society must justify its inequalities. Reasons must be found for them; otherwise the entire political and social edifice threatens to collapse.
Thomas Piketty, Capital and Ideology, 2019.
This is the opening sentence of Piketty’s latest major work. It sets out a strong thesis: no society tolerates raw inequality, and none lets the gap between rich and poor exist without a narrative that makes it livable. When the gap is too wide, or too visible, or too arbitrary, the edifice is in danger. So it has to be justified, and the grammar for doing so varies with place and period. Europe’s old regimes did it through birth and divine grace. Liberal democracies recast it in terms of merit, effort, and talent. Modern economic theory, since Roemer, has learned to distinguish the part of inequality that follows from individual choices from the part that follows from circumstances of birth. The first can, in principle, be justified. The second cannot.
THE NARRATIVES THAT HOLD UP THE EDIFICE
Haiti does not have one narrative; it has several, which operate at the same time and take over from one another depending on who is speaking. The narrative of merit exists here, as it does everywhere, but it behaves in a particular way. Listen carefully to Haiti’s public debate on inequality and what you actually hear are three other registers, often intertwined, and more present than the standard meritocratic narrative. They are worth naming before we look at what the numbers do to them.
The first register is that of the historical curse. The French debt of 1825, the occupations, the embargo, the earthquake, the hurricanes, and the list goes on. This narrative has the force of partial truth: these events really happened, and they really did impoverish the country. But it also has an internal function, a more discreet one. By attributing all poverty to the outside, it erases the question of distribution inside. If everything comes from outside, then the minister and the peasant are in the same boat before history. The narrative of a shared curse absolves private disparities.
The second register is that of destiny. Chak moun gen chans pa l: everyone has their own luck. The Creole saying, widespread in popular common sense, does not have the same structure as merit. It does not say that whoever succeeded worked harder. It says that the current distribution of goods and positions is, if not fair, at least inevitable. A cosmology, older than any economic theory, which makes the inherited share invisible by disguising it as mystery. Under this cosmology, demanding an account of where a fortune came from becomes almost impious. What happened was meant to happen.
The third register is that of moun pa, literally “my own,” and everything that flows from it: the pwen, protection, the extended family network. In a society where the state redistributes almost nothing, the network does it instead. And the network has its own morality: you take care of your own. The privileged are not accused of injustice as long as they redistribute to their circle. The inherited share is not denied; it is ennobled, because it feeds a chain of obligations. This is the subtlest of the three registers, because it does not deny inequality: it makes it moral.
Alongside these three registers, and more discreetly, operates the classic meritocratic narrative. It is invoked mainly by the privileged, in professional settings, in private-school brochures, in interviews with business leaders. It serves less to understand inequality than to justify oneself for holding the position one holds. What is distinctive about Haiti, then, is not the absence of merit. It is the coexistence of merit with three other narratives that together do the work merit does on its own in liberal democracies. Each of these narratives covers a portion of inequality that public debate is thereby spared from examining.
AN INSTRUMENT FOR MEASURING WHAT IS INHERITED
These four narratives do not say the same thing, but they produce the same effect. None invites the simple question: of the gap separating the man born in Pétion-Ville from the man born in Bombardopolis, how much is due to what each has done, and how much to what each was handed?
The narrative of merit refuses the question because it already has its answer: the gap is entirely explained by effort, and those who have not succeeded have only themselves to blame. The narrative of the curse deflects it outward: it is none of our business; it is the debt, the embargo, the earthquake. The narrative of destiny makes it impious: what happened was meant to happen, and one does not call fate to account. The narrative of moun pa does not ask it either, but for a different reason: it acknowledges inequality and finds it moral, because it feeds the chain of obligations that holds the social fabric together in the absence of the state. Four different ways of not having to measure.
To measure, one has to step outside the narratives. What is needed is an instrument that depends on no justification, asks nothing of culture, and simply breaks a gap down into two portions and puts a number on each. Economics has offered one for some thirty years, and it is the subject of the rest of this piece.
The instrument comes from the work of John Roemer and can be stated in a single sentence. When we look at inequality among adults, we can separate what follows from circumstances of birth (sex, the department where one first opened one’s eyes, the father’s occupation, the mother’s language, the family’s religion) from what follows from the individual’s choices (trade-offs, risks taken, years spent learning). The first part has nothing to do with what the person did. The second does. No narrative, whether of merit, curse, destiny, or protection, can turn the first into something just.
From this separation, economists have built a measure. It is called inequality of opportunity, or IOp for short. It is the fraction of a country’s total inequality that is explained by circumstances of birth alone. Formally:
IOp = I({μk}) / I(y)
Without going into the machinery, here is what the formula does. In the denominator, at the bottom, goes the country’s total inequality. In the numerator, at the top, we calculate the inequality that would remain if everyone born in the same conditions received exactly the same income. The ratio of the two gives, as a percentage, what circumstances explain. If the value is 25 percent, it means that a quarter of the gaps between Haitians is explained solely by the conditions in which they started out. The rest, 75 percent, may still, in theory, come down to effort, choices, luck, or skills.
The important words in the previous sentence are “in theory.” We will come back to them. For now, let us hold on to the idea: a single number that measures what, in people’s lives, does not depend on them.
This measure has been calculated for most countries in the world. Not for Haiti. When Francisco Ferreira and Jérémie Gignoux studied six Latin American countries in an article published in 2011, they found IOp shares ranging from 24 to 50 percent. Put differently: in Brazil, in Peru, in Guatemala, between a quarter and a half of the gap between citizens’ incomes is already decided on the day they are born. The rest is negotiable. That first share is not.
For Haiti, we do not know. No one has published the figure. The main reason is that the last usable national survey, the Post-Earthquake Household Living Conditions Survey (ECVMAS), dates from 2012. The country measures its inequality with an instrument that is fourteen years old. Meanwhile, public debate goes on citing the Gini coefficient, which the World Bank puts at about 0.61 for consumption, as if it were an adequate thermometer. But the Gini is a fever without a diagnosis: it says there is a great deal of inequality, but not a word about where that inequality comes from, or how much of it is inherited.
The country measures its inequality with a fourteen-year-old thermometer. And what is passed on at birth remains, for lack of recent data, outside the scope of measurement. And therefore outside the debate.
TWO FINDINGS THAT MATTER FOR HAITI
Two researchers, Kristof Bosmans and Z. Emel Öztürk, have recently clarified what such a measure can say, and what it cannot. For Haiti, two of their findings really matter.
The first can be summed up in an image. Imagine a poverty map drawn first in three broad zones: the city, the coast, the mountains. Gaps are already visible. Redraw it to distinguish the ten departments: you see more gaps. Redraw it again, separating town and countryside within each department: you see more still. These gaps were there from the start. The coarse map was hiding them. The closer you look, the more visible the inherited share becomes.
The consequence for Haiti is direct. Our surveys measure almost none of the circumstances that matter: not the father’s occupation, not the parents’ education, not the language spoken at home in childhood. Any published figure for the inherited share is therefore, necessarily, a minimum. The true figure is higher.
The second finding concerns schooling. The international rule files education under personal choices, as if studying were a matter of merit alone. Reading Table 2 will show why this rule does not hold in Haiti.
WHAT THE HAITIAN DATA SAY
Table 1. Inequality of opportunity, household welfare, ECVMAS 2012
Welfare indicator: imputed rent per person (HTG/month). 4,777 households, 23,295 people. Preliminary calculations on ECVMAS 2012.
| Accounting for… | N groups | IOp share | Confidence interval |
|---|---|---|---|
| Department of birth alone | 10 | 10.3% | n/a |
| + Area of residence | 21 | 19.0% | 17.1 to 22.5% |
| + Having lived in a displacement camp | 23 | 25.0% | n/a |
A word on the indicator before reading. Why rent, and not income? Because in a country where most economic activity is informal, a month’s income says almost nothing: it fluctuates with the harvest, it leaves out what households produce for their own consumption, it ignores transfers. The house a household lives in, by contrast, does not fluctuate. It sums up years of accumulated economic capacity, and it is precisely this durable position, the one that gets passed on, that the measure of inequality of opportunity seeks to capture. For tenants, we take the rent paid. For owners and rent-free occupants, who are the vast majority, we estimate what their dwelling would cost if it were rented, based on its characteristics. This is standard practice in the World Bank’s consumption aggregates. One limitation must be stated: the imputation relies partly on the dwelling’s location, and location also appears among the circumstances in the table. The shares that follow may therefore be slightly flattered by this overlap, all the more reason to read them as orders of magnitude, and the reason why Table 2, built on labor income, an independent measure, serves as a cross-check.
How to read this table. The first row says: if we know nothing about people except the department they were born in, we already capture 10.3 percent of all welfare inequality in Haiti. In other words, department of birth alone explains a tenth of the gaps. That is already considerable, given that there are only ten departments and nothing else was asked.
The second row adds area of residence: metropolitan area, secondary town, or countryside. The share captured almost doubles: 19 percent. What we are seeing at this point is exactly what the Bosmans–Öztürk theorem says: nothing has changed in reality; we have simply looked more closely. Part of the inequality that looked like individual noise turns out, in fact, to be structured by the setting in which the person grew up.
The third row adds having lived in a camp for internally displaced persons: 25 percent. With three variables relating to birth and to forced trajectories, we already capture a quarter of the gaps. And all we have measured are very crude things: geography and post-earthquake displacement. Nothing on family, parents’ occupations, language, schooling. The true figure lies elsewhere, and higher.
Table 2. Inequality of opportunity, individual labor income, adults aged 25–65
Subsample: 2,961 Haitian-born adults. Religion grouped into 4 categories, education into 4 levels. The last row adds adult-trajectory variables and should be read as an exploratory upper bound, outside the strict framework of circumstances of birth.
| Accounting for… | N groups | N | IOp share |
|---|---|---|---|
| Sex alone | 2 | 2,961 | 0.2% |
| + Department of birth | 20 | 2,961 | 3.8% |
| + Religion | 79 | 2,961 | 8.4% |
| + Education level (treated as a circumstance) | 257 | 1,891 | 25.1% |
| + Area of residence, how the job was obtained, international mobility | 622 | 1,887 | 49.0% |
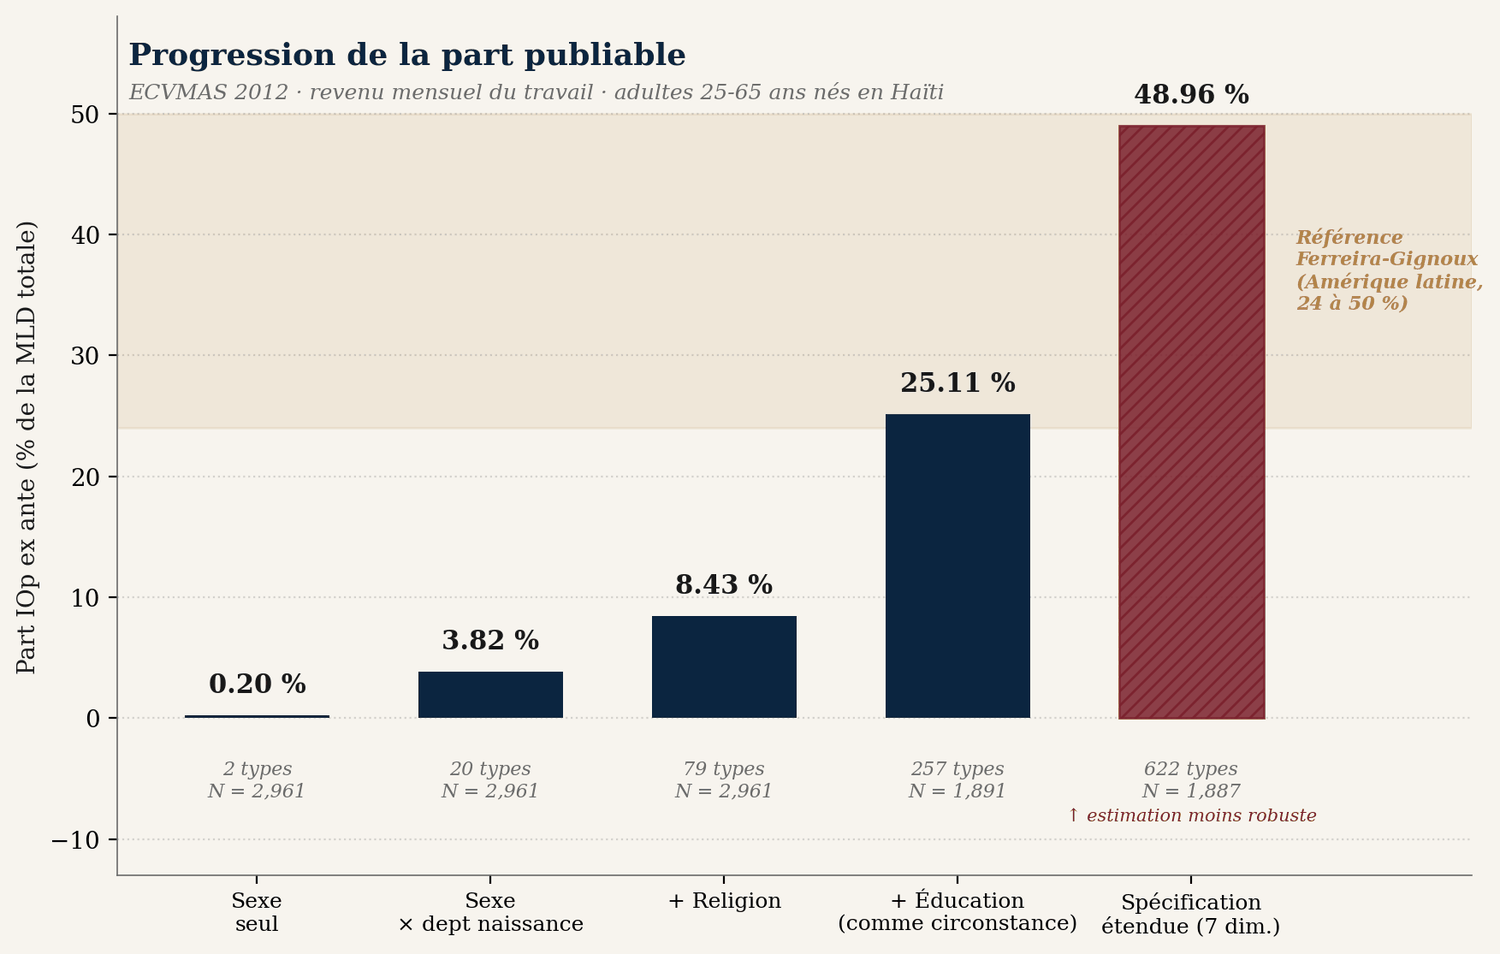
Here the measuring instrument changes. Table 1 dealt with household welfare, proxied by rent. Table 2 deals with individual labor income, and it is the heart of this piece. Two different yardsticks, hence two different levels of figures: what matters is not to compare them term by term, but to see that in both cases the inherited share rises the closer we look. This table reads like a staircase, climbed one step at a time.
First step: sex alone. Barely 0.2 percent. The conclusion is simple, and it is correct: in the Haitian labor market, what separates men from women on average carries almost no weight in total inequality. This does not mean there is no sex-based discrimination; it is real, and documented elsewhere. It means that the gaps between men and women are much smaller than the gaps within each sex. Haitian poverty is massively ungendered because it is, quite simply, massive.
Second step: add department of birth. The share jumps to 3.8 percent. A Haitian born in the Nord-Est and a Haitian born in the Ouest are not dealt the same cards. Place of birth alone already captures nearly twenty times what sex did.
Third step: add religion. The share doubles again, to 8.4 percent. Here we have to pause. Religion in Haiti is not a private opinion. It is a marker of network, of the kind of school attended, of parish, and therefore of access. The fact that it carries so much weight does not mean that God plays favorites. It means that Catholic schools, Baptist schools, and Methodist schools build different trajectories, and that children had no say in the choice of their baptism. One caveat is in order, however: the survey measures religion as declared in adulthood, not religion in childhood. People do convert, so what is captured here is an imperfect reflection of the circumstance of birth. The share attributed to religion should be read with that caution in mind.
Fourth step, and this is the one that changes everything. We add education level, but treated as a circumstance, that is, as something received rather than chosen. The share rises to 25.1 percent. Slightly above the lower bound of the Latin American range. First, a note on reading: from this step on, the sample shrinks from 2,961 to 1,891 adults, those for whom education level is recorded. The shares for the previous steps, recalculated on this smaller subsample, remain of the same order, which allows comparison from one step to the next. To understand why this step is so high, one has to recall how Haitian schooling works. According to data from the Ministry of National Education, more than 80 percent of basic education is private. Enrollment fees vary with families’ ability to pay. Higher education runs through competitive exams, recommendations, and scholarships obtained through networks. A child who completes secondary school in Haiti has not merely worked hard: behind that child there is also a father who could pay, a mother who could keep up with the homework, and probably a family close to Port-au-Prince, because that is where the good secondary schools are concentrated.
Yet international convention, followed by most economists, places education on the side of choices. The move is defensible in countries where primary school is universal, public, and of uniform quality. There, one can argue that a child who studied truly chose to. In Haiti, the same move becomes a sleight of hand. What is, to a large extent, an endowment is treated as effort. The result can be seen by comparing two calculations on the same subsample of 1,891 adults: with the same three circumstances as the previous step (sex, department, religion) and education left on the side of effort, the inherited share comes out at 9.3 percent. This figure does not appear in the table; it is the table’s counterfactual. As soon as we stop treating education as a personal choice, the share rises to 25.1 percent. It triples. No one worked any more or any less. No one earned any more or any less. It is the convention that changed, and that convention is the one the country has adopted by default, without ever discussing it.
Deciding that school is effort, or deciding that it is a circumstance: same data, same indicator, but two different countries. One publishes 9 percent. The other publishes 25.
Fifth step: the extended specification. We add current area of residence, how the job was obtained, and having recently lived abroad for more than a month. The share reaches 49 percent. This step must be presented for what it is: it is no longer quite a measure of inequality of opportunity in the strict sense. The three added variables are not circumstances of birth; they are elements of an adult trajectory, in which the person’s own choices play a part. How the job was obtained, in particular, is so close to income itself that it mechanically explains a fraction of it. So the question changes: we are no longer measuring only what was given at the outset, but how much of income is explained by social position, inheritance and trajectory combined. Two further caveats apply. With 622 combinations for 1,887 people, many groups contain only two or three individuals, and such a fine partition tends, by statistical construction, to inflate the figure. The 49 percent should therefore be read as an exploratory upper bound, not as a result on a par with the 25.1. What this step says robustly is simpler: with each additional dimension we agree to measure, the explained share rises, and most of what rises runs through channels, setting and network, that are themselves passed on. And there is more still: we still do not have the father’s occupation.
Chart 1. The closer you look, the larger the inherited share
THE ANSWER, IN PLAIN TERMS
We can now answer the question we began with. When we measure income inequality among all Haitians, at least a quarter of that inequality is explained by circumstances no one chose: department of birth, setting, access to school. That is the solid figure, the one obtained with only the variables available. And it is only a floor. The circumstances no Haitian survey measures, such as parental education or the language of childhood, pull this figure upward: wherever they have been measured, they are the ones that weigh most. The broadest specification computed here, which admittedly mixes inheritance and trajectory, rises to 49 percent and gives the order of magnitude of the ceiling. The answer lies somewhere between a quarter, which is certain, and a half, which is plausible. For our two young men from Pétion-Ville and Bombardopolis, this means that a good part of the gap between them was already written before either had done anything at all with his life.
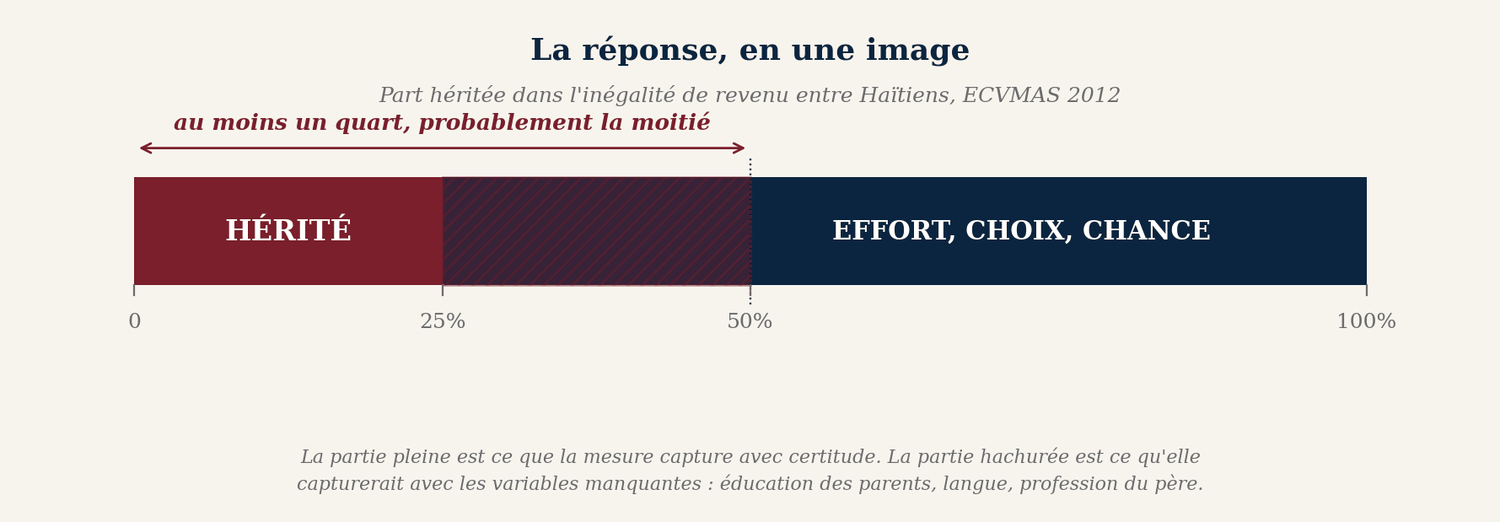
The rest of this piece shows, figure by figure, where this inherited share comes from. Three things above all make it up: department of birth, the setting one grows up in, and access to a school that has to be paid for.
WHAT THE TYPES TELL US
Let us leave the aggregate percentages for a moment and come down to specifics. Crossing department of birth with area of residence gives some thirty cells. Each represents a type of person. Born in the Artibonite and living in the countryside. Born in the Ouest and living in the metropolitan area. And so on. Each cell has its median income.
On housing income per person, the eight poorest cells are all rural, every one of them. In order: Artibonite, Nord-Ouest, Grand’Anse, Nord-Est, Centre, Sud-Est, Sud, Nord. The richest is the Port-au-Prince metropolitan area. The ratio between the two extremes reaches 9.4 to 1. To make this figure readable: for every thousand gourdes the average Port-au-Prince resident spends per person on housing, the rural dweller of the Artibonite, of the Nord-Ouest, of the Grand’Anse spends just over a hundred. His house is worth a tenth of the other man’s. No one chose this house at birth. No one can, by willpower alone, build another.
Chart 2. Labor income by department of birth and area of residence
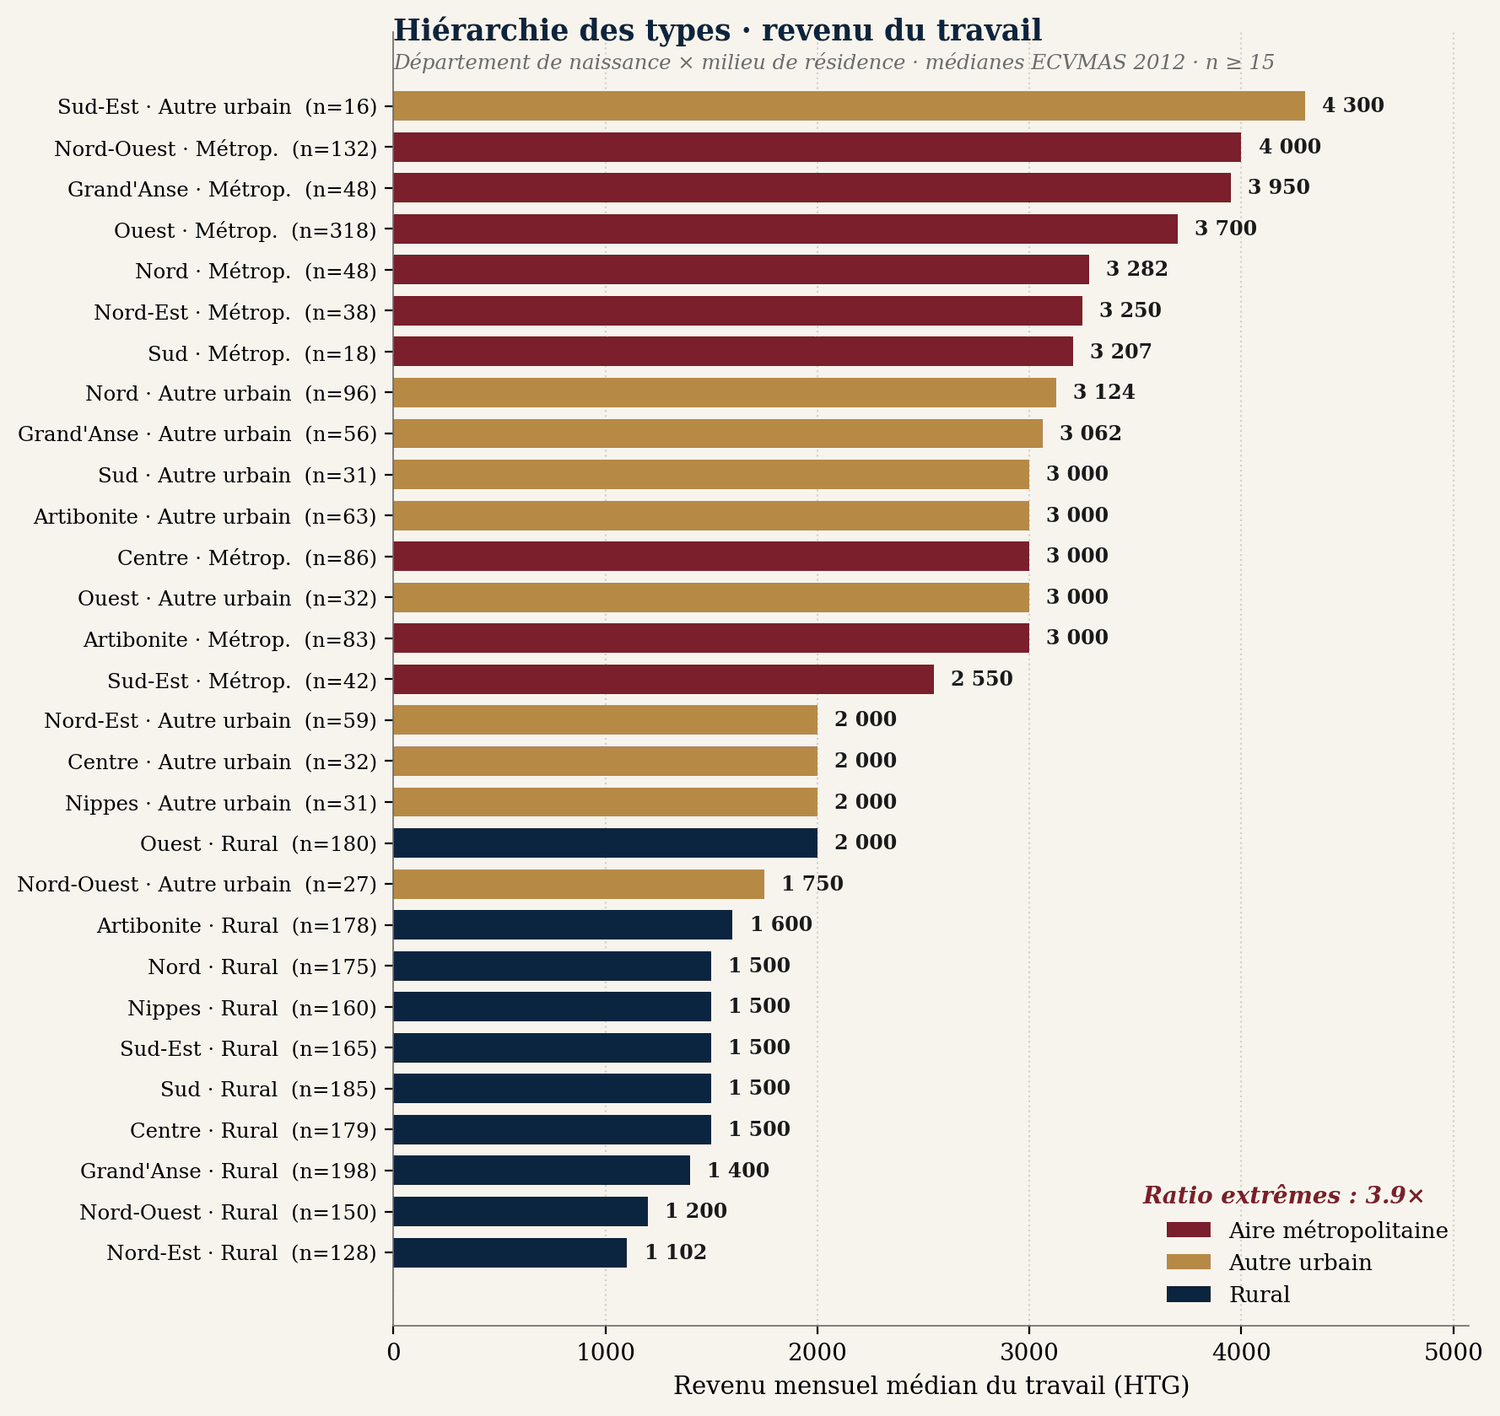
The chart can be read without any arithmetic, and that is what makes it harsh. It takes decades of structural divergence to produce such a hierarchy. Decades during which the state built roads here and not there, schools here and not there, formal jobs here and not there. No one in the current generation made these choices. They were handed down. They are imposed.
That leaves education, which, as we saw, weighs heavily in the previous table. The education-income gradient also deserves a closer look. One imagines it steep: the country sells school as the main elevator to a better life. The data describe an elevator that starts in the basement, and that only truly lifts those who step in with something more than their diploma.
Chart 3. What a year of school pays
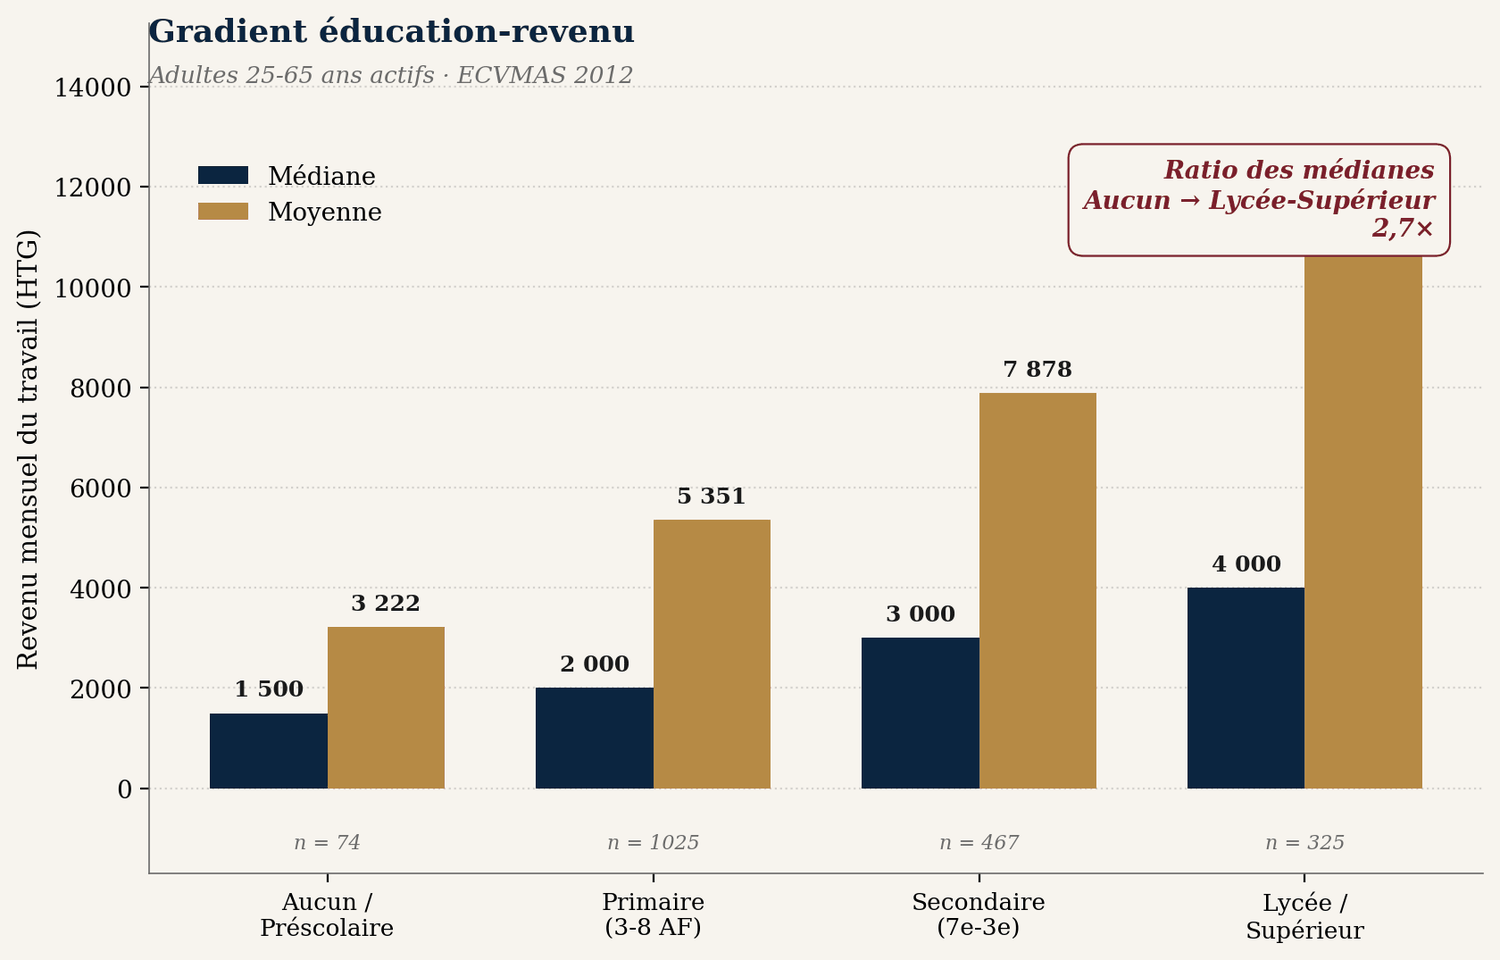
The median monthly income of an adult with no schooling is 1,500 gourdes. That of an adult who reached secondary school or university is 4,000 gourdes. The ratio between the two is 2.7. Spread over the years of study, this multiplier corresponds to a return of about 8 percent per year of schooling, which is, in fact, within the global norm for wage equations. The Haitian problem, then, is not that school pays nothing. It is twofold. First, the starting point is so low that multiplying 1,500 gourdes by 2.7 still leaves the median graduate in poverty: the elevator works, but it starts in the basement. Second, and above all, this median return looks nothing like the promise. Many Haitian schools sell their pupils the idea of a spectacular leap once they have their baccalaureate. The distribution says otherwise: the spectacular leap exists, but it is reserved for a few.
The contrast between median and mean tells the rest of the story. Mean income at the secondary-or-higher level reaches 11,732 gourdes, three times the median. This means that at this level of education, a fraction of adults earn very well and pull the mean upward, while the majority stay around the median 4,000 gourdes. In the Haitian labor market, education does not produce a general improvement. It produces a modest improvement for most, and a spectacular one for a few. Those few are not, as a rule, better educated than the others. They are better placed. On top of the diploma, they have a name, a network, a family, a neighborhood. It is that combination, and not education alone, that pays.
THE TWO ENDS OF THE DISTRIBUTION
To complete the tour, let us look at the extremes. Of the 2,961 adults in our sample, the top decile, that is, the best-paid 10 percent, earns a median of 20,000 gourdes a month. The bottom decile, the worst-paid 10 percent, earns 400. The ratio is 50 to 1.
To make this figure readable, here is the translation. Over an entire year, the bottom decile earns 4,800 gourdes. The top decile earns as much in six days. What the rural dweller of the Artibonite, of the Nord-Ouest, of the Grand’Anse takes a year to earn, the metropolitan manager makes in less than a week of work. This is not a metaphor: it is simple arithmetic, which anyone can redo on a phone calculator.
Chart 4. What separates the person who earns 400 from the person who earns 20,000
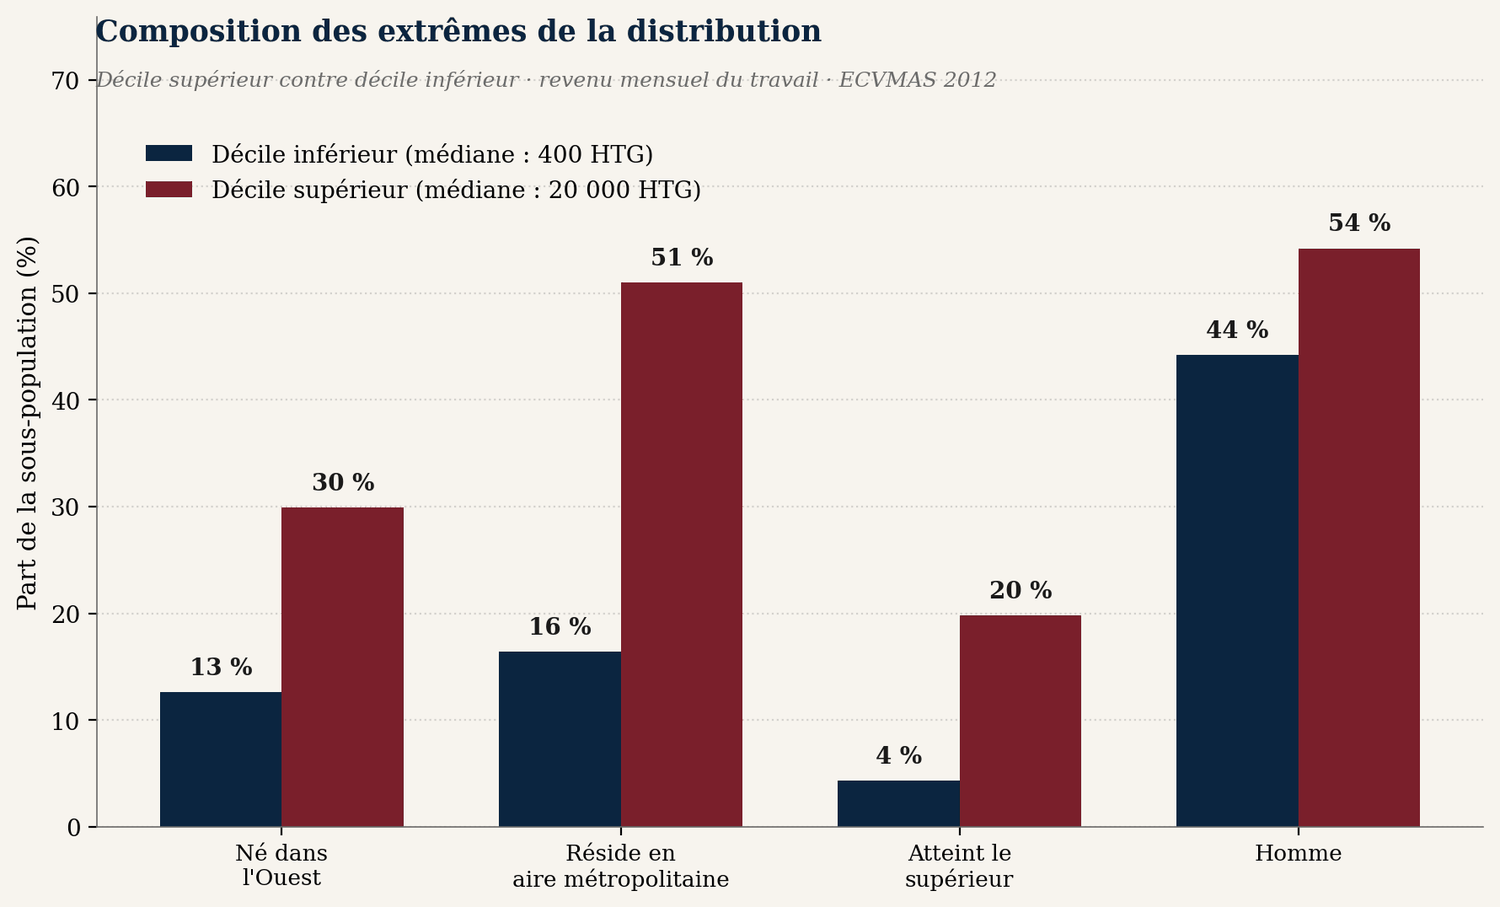
In the top decile, one adult in two lives in the metropolitan area. In the bottom decile, one in six. In the top decile, three in ten were born in the Ouest. In the bottom decile, one in eight. In the top decile, one adult in five reached secondary school or university. In the bottom decile, one in twenty-five. None of these differences tells a story of unequal effort. They tell of a geography, a city, and a schooling path whose terms of access are set by parents’ wallets.
WHAT GOES UNMEASURED AND CARRIES THE REST
Everything we have just seen, already enough to cause concern, still falls far short of what theory predicts. The variables measured by the ECVMAS cover a narrow fraction of the circumstances that really matter in Haiti. Three variables missing from national surveys deserve a place in them.
First missing variable: parental education. In every country where it has been measured, it is, on its own, the most powerful predictor of an adult’s income. More powerful than the adult’s own diploma. More powerful than his or her occupation. Quite simply because it sums up, in a single number, what the parents knew, what they could pass on, what they could pay for, and the quality of the schools in the neighborhood where they had settled.
Second missing variable: the father’s occupation. It tells us which professional network the adult stepped into, the first recommendations, the first reading of the world of work.
Third missing variable, and this one is specifically Haitian: the first language of childhood. A child who has only ever spoken Creole at home does not enter secondary school as well equipped as a child who heard French every evening. The rest is well known: secondary school in French, university in French, formal employment in French. Every Haitian teacher knows this variable. No survey measures it. No decomposition of inequality of opportunity captures it. And yet it is probably, in Haiti, one of the channels through which the inherited share passes most quietly from one generation to the next.
WHAT THE NUMBERS DO TO THE NARRATIVES
Let us return to the narratives that, at the outset, together justified Haitian inequality. Merit for the privileged, the curse for public debate, destiny for common sense, moun pa for the network. Now that the numbers have spoken, we can call them to account one by one.
Against the narrative of merit, the numbers set a simple fact. For labor income, a higher-education diploma multiplies median income by only 2.7, a respectable return in percentage terms but one that, starting from 1,500 gourdes, leaves the median graduate poor. Education matters, but on its own it does not explain the large gaps. What explains them better is access: a diploma pays more when it comes on top of a name, a neighborhood, a family, a milieu. Merit, in the strict sense, does less than half the work.
Against the narrative of the historical curse, they set a measurable internal distribution. The debt, the occupations, the embargo, the earthquake were real. But they did not hit all Haitians equally hard. A child born in Pétion-Ville to a civil servant in 1980 and a child born in Bombardopolis to a farmer the same year lived through the same earthquake, the same embargo, the same national impoverishment. Thirty years later, their incomes bear no resemblance to each other, and the ratio of 50 between the extreme deciles shows how far the gap can go. The curse is shared; the inheritance is not. The narrative that claims to absorb everything into an external fate makes at least a quarter of real inequality disappear: the inequality that reproduces itself within, generation after generation, among people who all lived through the same disasters.
Against the narrative of destiny, of chak moun gen chans pa l, the numbers set a geography. The Port-au-Prince metropolitan area is home to one adult in two in the top income decile. One adult in six in the bottom decile. That is not luck; it is an address. The Ouest supplied three adults in ten at the top, against one in eight at the bottom. That is not destiny; it is a department. The poorest types, ranked by housing income per person, are all rural, and it took decades of concrete budget choices to make them so. Haitian destiny, examined in the light of the data, has a name: it is called the allocation of roads, schools, formal jobs, hospitals. No cosmology drew these lines. Men drew them, meeting in offices, on specific dates, over administrative maps.
Against the narrative of moun pa, the numbers set the effect of the narratives’ coexistence. Merit alone, as we have seen, is not enough to explain social position. But moun pa, which might pass for its legitimate moral complement, inherits its function. When the state redistributes almost nothing, the network does the distributing. When the diploma is not enough to lift someone up, the extended family does the lifting. What the network takes on, the state could have taken on. That it has not is not a cultural fate; it is an effect of the persistent weakness of public institutions. Moun pa is not a fraud. It is an informal institution that fills the void left by the formal one and that, in doing so, reproduces inequality from one generation to the next through channels that measurement cannot capture.
Every society justifies its inequalities, says Piketty. Haiti justifies its own through four narratives that take turns: merit for the privileged, the curse for public debate, destiny for common sense, moun pa for the network. The numbers do not refute these narratives. They reveal their function.
That function can now be stated plainly. The four narratives are not lies. Each contains a measure of truth. But together they act as a veil that keeps the simple question from being asked: in the gap between Pétion-Ville and Bombardopolis, how much is effort and how much is inheritance? The measure of inequality of opportunity, read with caution, suggests that the inherited share is at least 25 percent in existing surveys, and that it probably approaches 50 percent once we include the variables those surveys do not measure: parental education, the father’s occupation, the language of childhood. These variables, in Haiti more than elsewhere, transmit position from one generation to the next.
In the fraction that remains, effort plays its part. And that must be said, because it is in this fraction that each individual trajectory is won or lost, at the margin. A determined child who meets a good teacher can, and it has happened, overcome harsh starting conditions and end up a lawyer, an engineer, a doctor. But this fraction is smaller than everyday talk about success suggests. And the official measure, the one international convention allows to be published, is the lower bound of a lower bound.
Until the national survey is redone, the figure will remain unknown. And as long as it remains unknown, the inherited share remains unnameable. What goes unnamed goes undebated.
Fourteen years have passed since that snapshot. The country has kept changing. Language, network, and department of birth have kept operating as silent capital, recorded on no balance sheet. Without a new survey, we do not know by how much the inherited share has changed. But it is still there, and the narratives go on making it bearable.
WHERE TO BEGIN
Once the inherited share has been named, it can be acted upon. Not to promise equality, which exists nowhere, but to reduce what is passed on without anyone choosing it and weighs on a person from birth.
Four levers exist, and none is out of reach. Finally redo the national survey, so that we know. Make school public and free up to secondary level, so that the diploma no longer depends on parents’ wallets. Spread public investment beyond Port-au-Prince, so that department of birth weighs less heavily. And recognize Creole as the language of instruction in primary school, so that the language of childhood stops acting as a filter.
None of these levers depends on growth, international aid, or the return of security. They depend on a single decision: to stop treating the inherited share as a natural given and start treating it as a fact that can be corrected.
The question is no longer whether the inherited share exists. The numbers say it does. The question is whether the country will choose to measure it, name it, and reduce it, or whether it will go on leaving it to destiny and to moun pa.
This piece does not settle the matter. It brings a number out of silence: of the gap that separates two Haitians, at least a quarter, and more probably much more, is decided at birth. To the child from the Grand’Anse who will one day read it, it offers one certainty. What happened to that child at birth can be measured. And what can be measured can be repaired.
SOURCES. ECVMAS Haiti 2012 (IHSI, World Bank, DIAL), individual file, 23,775 observations. Author’s calculations on a subsample of Haitian-born adults aged 25–65, n = 2,961. Table 1: preliminary calculations on the ECVMAS 2012 household file. Piketty T. (2019), Capital et idéologie, Éditions du Seuil. Ferreira F. H. G., Gignoux J. (2011), “The Measurement of Inequality of Opportunity,” Review of Income and Wealth 57(4), 622–657. Roemer J. E. (1998), Equality of Opportunity, Harvard University Press. Bosmans K., Öztürk Z. E. (2021), “Measurement of inequality of opportunity: A normative approach,” Journal of Economic Inequality 19(2), 213–237. Gini coefficient: World Bank, WDI indicators based on ECVMAS 2012. Structure of basic education: MENFP, school census. Full methodology and audit trail in the annex document.