Can Haiti Catch Up with the Dominican Republic? The Dizzying Arithmetic
First published in Le Nouvelliste on 21 October 2026. Read on lenouvelliste.com ↗
Translated from the French original. In case of discrepancy, the French text prevails. Read the French original
How many years would it take for a Haitian to produce as much as a Dominican, a Jamaican, or a Cuban? This column answers with a calculation whose assumptions are stated openly: about a generation to draw level with Jamaica and Cuba at an exceptional pace, more than sixty years for the Dominican Republic. It shows that most of the gap comes down to productivity, and therefore to institutions and security, and proposes six levers to set catch-up in motion.
What a Haitian produces in a whole year, a Dominican produces in six weeks, a Jamaican in three months, and a Cuban in four. Hence a simple question: how many years would it take for a Haitian to produce, on average, as much as a Dominican, a Jamaican, or a Cuban? No one can predict it with certainty. A calculation can, however, give orders of magnitude, provided its assumptions and limits are stated at the outset. If the Haitian economy grew every year at the pace Bangladesh and Vietnam have sustained since 1990, it would take about a generation, 24 to 34 years, to draw level with Jamaica and Cuba. To draw level with the Dominican Republic, which keeps moving ahead, it would take more than sixty years, even at an exceptional pace.
Yet the main constraint is not the one people imagine. What is lacking, first and foremost, is not factories or schools but the country’s capacity to make the most of the resources it has. The wealth gap lies first in the effectiveness of institutions, in security, and in the stability of the economic environment.
The question everyone asks
Every Haitian who has crossed the border at Ouanaminthe or Malpasse has asked the same question on seeing the infrastructure, the street lighting, and the bustle of the shops on the other side: how many years would it take us to live like them?
The usual answer to that question is a sigh of resignation or an arbitrary prediction. This article proposes to answer it with a calculation, based on the theory of economic growth, on verifiable public data (World Bank, UNDP, Penn World Table, and the Maddison database, retrieved on 17 October 2026), and on transparent assumptions; the formulas are set out in the appendix. The analysis shows how the mechanics of falling behind took hold, what the gap is really made of, what carried the Haitian economy over the past thirty years and then gave way, what could upset these calculations, and what concrete lessons can be drawn from successes in the region and elsewhere in the world.
Before the numbers, their limits. This calculation predicts nothing; it extends trends and says what it would take to change them. It cannot anticipate breaks, whether a major change in governance or a technological leap such as the one artificial intelligence promises, and economic history is made of such breaks. The speed of catch-up it assumes, 2% of the gap closed each year, is a global average; some estimates put it two to five times higher. Haiti’s own data are fragile: the last major household income survey dates from 2012, and the World Bank, which classifies Haiti among conflict-affected countries, urges caution in reading its estimates. The sources also diverge: according to the Maddison database, the average Dominican produced 11.5 times as much as the average Haitian in 2022, against 7.6 times according to the World Bank. Finally, a per capita average says nothing about how wealth is distributed, whereas Haiti has one of the most unequal income distributions in the world (a Gini index of 0.6 according to the World Bank, September 2026). The years that follow are therefore orders of magnitude, not promised dates.
The direct answer: catch-up scenarios
If Haiti managed to raise its gross domestic product (GDP) per capita by 5 to 6% a year, a pace close to the one Vietnam and Bangladesh sustained from 1990 to 2022 (5.1% a year according to the 2023 Maddison database), it would reach Jamaica’s standard of living in 27 to 34 years and Cuba’s in 24 to 30 years, even if both countries keep advancing at their usual pace. For Cuba, these timelines rest on an estimate, because the island does not publish accounts comparable with those of its neighbors: with the Maddison figures, which place it higher, they would be about 45% longer. A child born today in Port-au-Prince would then reach adulthood in a country comparable to its island neighbors. With more modest growth of 4% a year, the path would stretch over four decades; at 3%, it would take more than sixty years. At the pace observed over the past thirty years, catch-up would never come, because Haiti is sliding backward.
The Dominican Republic poses a challenge on an entirely different scale. Its average inhabitant is now nearly nine times richer than the average Haitian, and the neighboring economy keeps moving ahead. Even if Haiti posted an exceptional 7% a year for several decades, it would take 67 years to catch up if the Dominican Republic holds its cruising speed, and 45 years if it slowed to 2%. If current trends continue, no adult alive today will see Haiti at the level of Santo Domingo. Not catching up does not mean gaining nothing. If Haiti brought together the conditions to live one day as Dominicans live today, its growth would start at about 6.7% a year and slow gradually; by around 2075, the average Dominican would no longer produce 8.7 times as much as the average Haitian, but less than 3 times as much. That change alone would transform lives on both sides of the border.
Table 1. Output per capita in dollars of comparable purchasing power (PPP 2021)
| Country | 1990 | 2019 | 2024 | Growth per year (1990–2024) | Growth per year (2019–2024) | Ratio to Haiti’s level (2024) |
|---|---|---|---|---|---|---|
| Haiti | 3,923 | 3,362 | 2,784 | -1.0% | -3.7% | 1.0 |
| Dominican Republic | 7,328 | 21,451 | 24,230 | +3.6% | +2.5% | 8.7 |
| Jamaica | 8,880 | 10,816 | 11,340 | +0.7% | +1.0% | 4.1 |
| Cuba (estimate, appendix A6) | 5,616 | 9,198 | 8,356 | +1.2% | -1.9% | 3.0 |
Sources: World Bank, World Development Indicators (retrieved on 17 October 2026); UNDP, Human Development Report 2025.
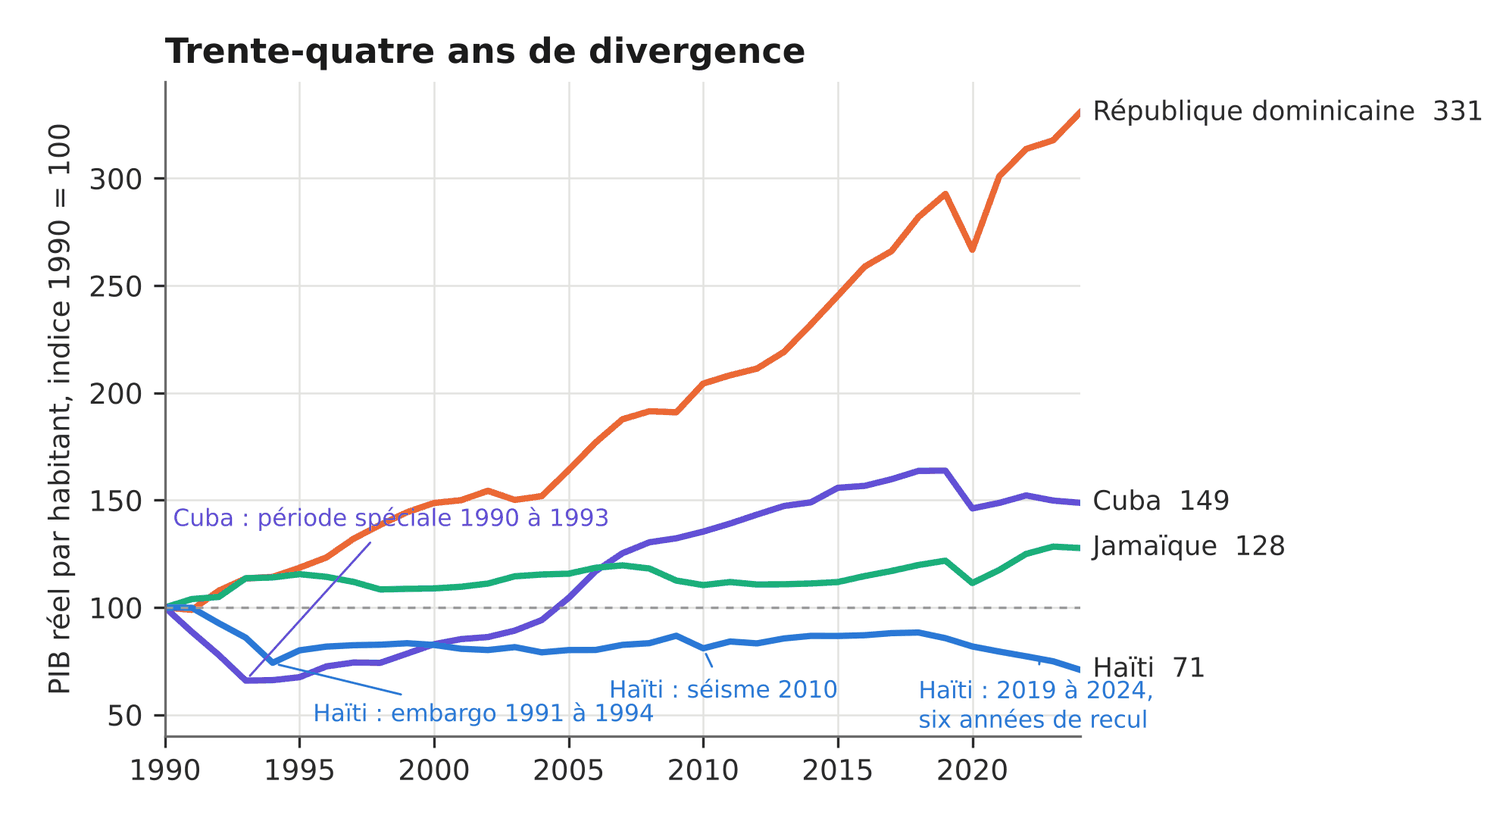
Three major trends emerge from this overview. First, Haiti’s decline is deep: in 2024, a Haitian has 29% fewer resources than in 1990 and 17% fewer than in 2019. Seven consecutive years of contraction, from 2019 to 2025, have wiped out the gains of the recoveries of 1995 to 1999, 2005 to 2009, and 2011 to 2014, and the World Bank expects an eighth decline in 2026 (Haiti country page, 7 October 2026). Second, the Dominican trajectory is a remarkable takeoff: the country multiplied its income per capita by 3.3 in 34 years (+3.6% a year), the twelfth-best performance out of 164 economies between 1990 and 2022 according to the Maddison database. Finally, Jamaica and Cuba show that geographic proximity does not guarantee strong growth: the former grew by only 0.7% a year, while the latter lost a third of its income per capita between 1990 and 1993 and another 9% between 2019 and 2024.
The economic mechanics of falling behind
Since the work of Solow and Swan (1956), economists have described growth as a race toward a ceiling of wealth specific to each nation. The farther a country is from its own ceiling, the faster it catches up. Once the ceiling is reached, progress settles at the pace of global technical innovation, about 2% a year.
That ceiling rests on four pillars: the share of income invested in infrastructure and equipment, population dynamics, the education level of the workforce, and the overall efficiency with which these resources are combined. This efficiency, which economists call total factor productivity, encompasses the institutional framework, the security of persons and property, the reliability of the power grid, and the effectiveness of the courts.
A country below its ceiling closes about 2% of the distance each year: Barro and Sala-i-Martin (1992) found this pace among US states as well as among OECD countries, and the formula of Mankiw, Romer, and Weil (1992) gives 2.1% with Haitian data (appendix A2). At that pace, half of the gap is closed in 33 years.
The central lesson for Haiti lies in a distinction. If all countries shared the same ceiling, the poorest would automatically catch up with the richest, and Haiti should grow about 4.5 percentage points faster than the Dominican Republic every year. In fact it has grown 4.6 points slower since 1990, and 6 points slower since 2019. Each nation converges only toward its own ceiling. Haiti is not simply lagging on the way to a high summit; it is stuck at the bottom of the rankings because its current ceiling is extremely low. Thirty years of stagnation show that wanting to run faster is not enough to make progress: the ceiling itself has to be raised.
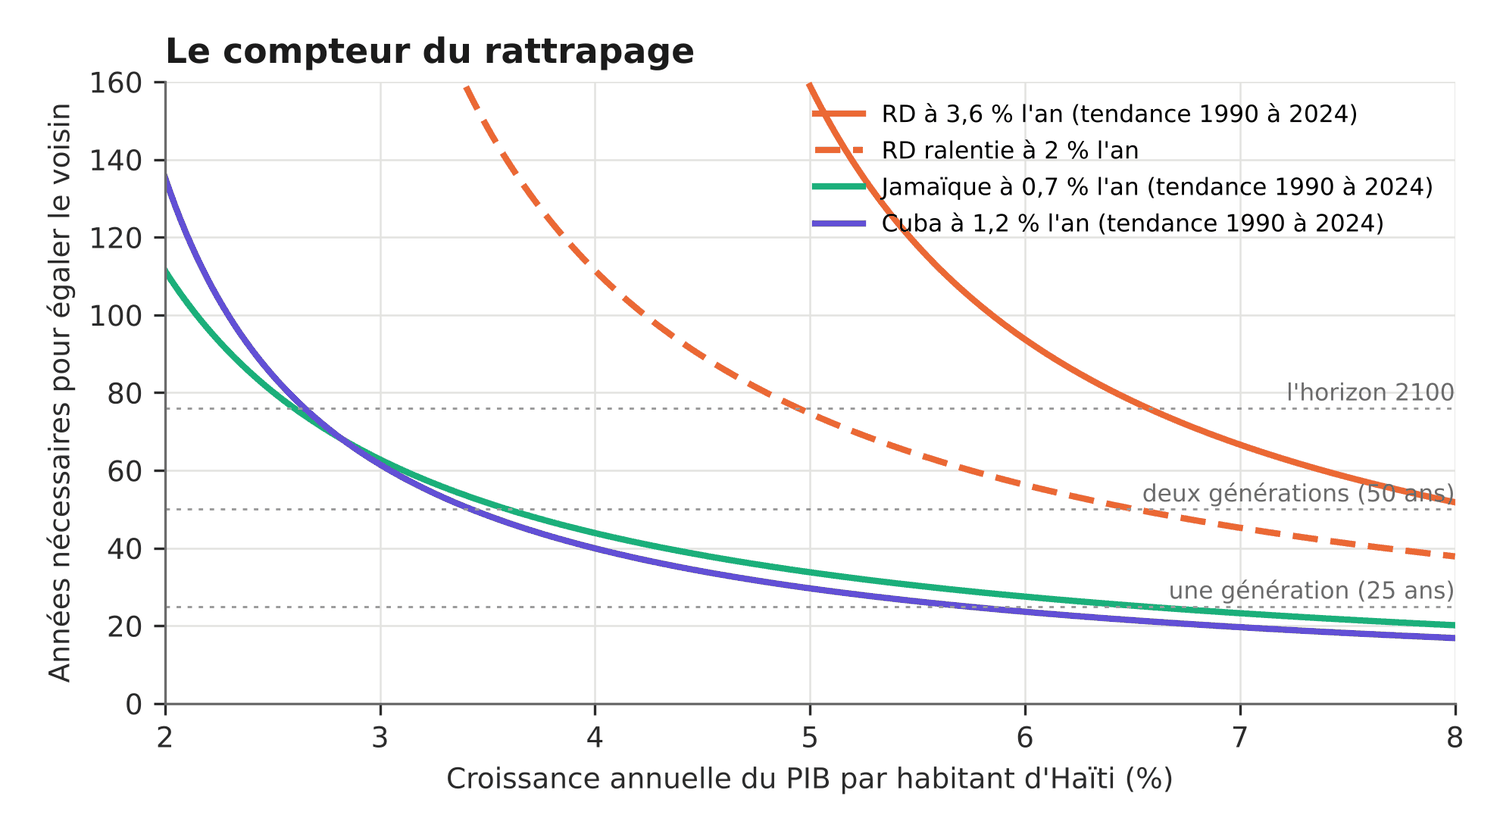
Table 2 translates these mechanics into years. It counts the way one counts between two cars on the same road: the size of the gap divided by the difference in speed (appendix A3). To gauge what these rates mean, 5% a year amounts to doubling living standards every fourteen years; since 1990, Haiti’s best recoveries have not exceeded 2.4% a year per capita.
Table 2. Years needed to match the neighbors’ standard of living (2024 levels)
| Haiti’s annual growth rate | Dominican Rep. (at +3.6% a year) | Dominican Rep. (slowing to +2% a year) | Jamaica (at +0.7% a year) | Cuba (at +1.2% a year) |
|---|---|---|---|---|
| 3% a year | Never | 222 years | 63 years | 61 years |
| 4% a year | 535 years | 111 years | 44 years | 40 years |
| 5% a year | 159 years | 75 years | 34 years | 30 years |
| 6% a year | 94 years | 56 years | 27 years | 24 years |
| 7% a year | 67 years | 45 years | 23 years | 20 years |
Author’s calculation, appendix A3, based on the levels in Table 1. All rates are average annual rates; those of the neighbors are their 1990–2024 trends.
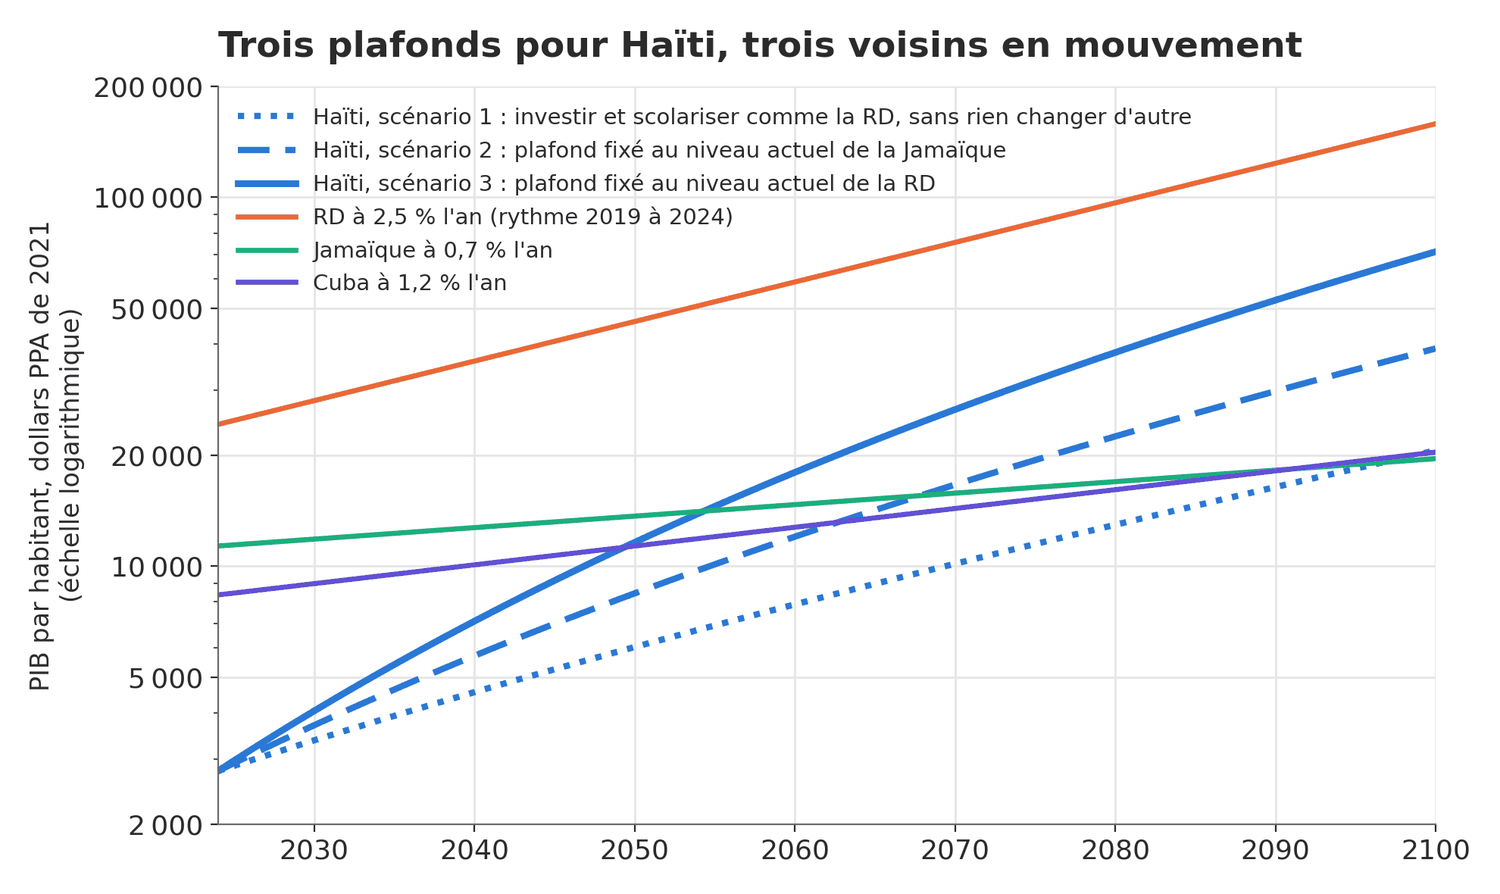
Yet a car slows down as it nears its ceiling. Figure 3 therefore traces three trajectories, depending on how high Haiti manages to raise its own (appendix A5). First case: Haiti matches the Dominican Republic’s investment and schooling, without changing anything else; its ceiling rises only to $5,100 per capita, its growth starts at 3.3% and then runs out of steam, and Jamaica and Cuba are caught only at the very end of the century, in 2097 and 2099. Second case: Haiti also brings together enough security and institutions to be able, one day, to live as Jamaicans live today; it would catch up with Cuba in 2063 and Jamaica in 2068. Third case: it brings them together to the point of being able, one day, to live as Dominicans live today; it would catch up with Cuba in 2050 and Jamaica in 2055, and the gap with Santo Domingo would fall below 3 to 1 by 2075. The Inter-American Development Bank, using a different model (Cicowiez and Filippo, technical note IDB-TN-1485, September 2018), arrived at the same order of magnitude: 185 years to reach the Dominican level in its baseline scenario.
Anatomy of the gap: what does Haiti really lack?
To set national priorities, the income gap between Haiti and its neighbors should be broken down into three components, following the method of Hall and Jones (1999): physical capital (factories and equipment), schooling (5.4 years on average in Haiti against 9.4 in the Dominican Republic and 10.0 in Jamaica, according to the Human Development Report 2025), and total factor productivity.
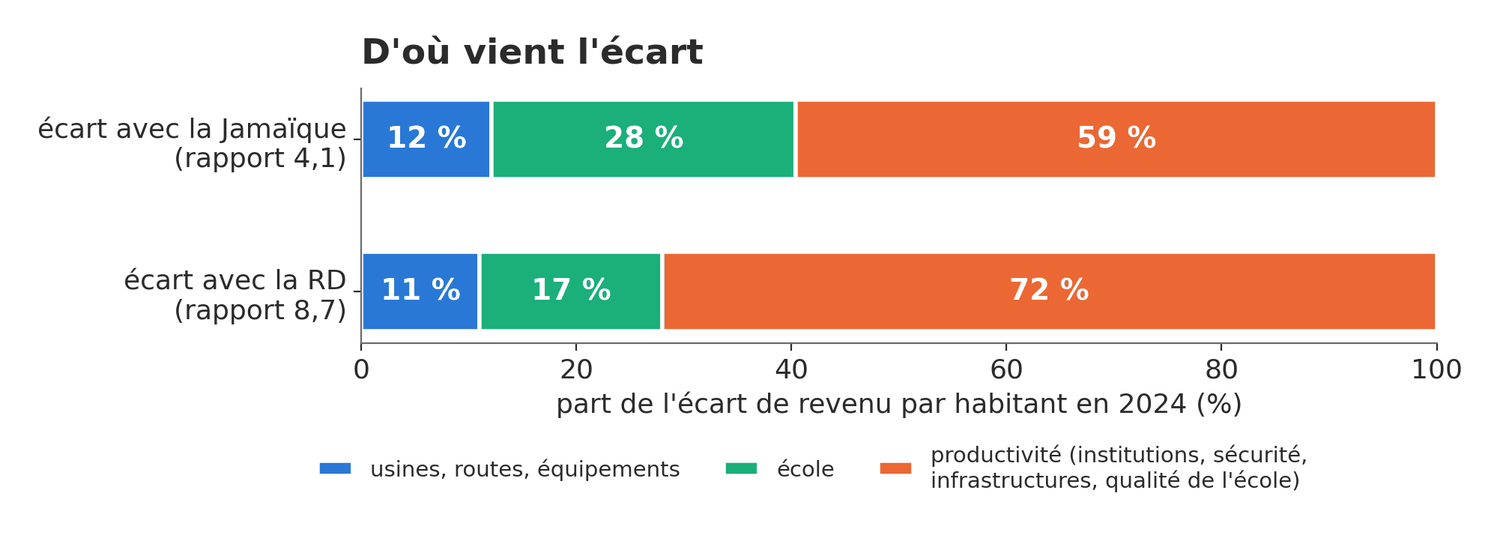
The analysis reveals a striking reality. Nearly 72% of the wealth gap between Haiti and the Dominican Republic comes down to total factor productivity. The shortfall in physical equipment accounts for only 11% of the difference, the schooling deficit for 17%. Against Jamaica, productivity still accounts for 59% of the divide. This figure is an order of magnitude, not a direct measure of the weight of institutions: it is obtained as a residual and lumps together everything that equipment and years of schooling do not explain, including the quality of teaching and the flaws in the statistics. Yet it captures the essential point: the largest share of the gap depends neither on the number of factories nor on the number of years spent in school. If Haiti invested and schooled like Santo Domingo without changing anything else, its income per capita would merely double, reaching one-fifth of the Dominican level.
This result profoundly changes the priorities. It does not mean that education or public works are useless, but that every gourde invested in a school or a road will keep yielding very low returns for as long as it is crippled by insecurity, political instability, power cuts, and the failings of the state. The World Bank measures this in its report Haiti: Pathways to Growth Amid Rising Risks (September 2026): productivity has been falling since 2019, the country is losing equipment faster than it builds it, and agriculture, which employs nearly half the workforce, receives less than 1% of formal credit. The report of the United Nations Panel of Experts, S/2025/356 (10 June 2025), offers an illustration: a container pays between $500 and $1,000 in tolls to gangs before it leaves the capital’s port.
What the neighbors did differently
Looking at our regional neighbors offers contrasting lessons about long-term development strategies.
Table 3. Overview of the region’s economic engines (1990–2025)
| Country | Key engines | Policy instruments | Observed limits |
|---|---|---|---|
| Dominican Republic (+3.6% a year) | Free zones (198,552 jobs in 2024), tourism (11.2 million visitors in 2024), diaspora remittances. | Law 8-90 on free zones (1990), private Punta Cana airport (1984), inflation targeting (2012). | Weak productivity gains (0.4 points out of 4.9), 53% informal employment, heavy electricity losses. |
| Jamaica (+0.7% a year) | Tourism, outsourced services (62,000 jobs in 2024), diaspora remittances. | IMF agreement (2013), monitoring committee with employers and unions (EPOC), catastrophe insurance. | Emigration of 80% of university graduates, crime costing at least 4% of GDP, climate shocks (Melissa, 2025). |
| Cuba (+1.2% a year) | Tourism, exported medical services ($8.2 billion in 2014), Venezuelan oil. | Legalization of the dollar (1993), oil-for-doctors agreement with Venezuela (2000), opening to self-employment (2010 and 2011), Mariel zone (2013). | Dependence on external shocks, acute energy crisis, demographic decline, GDP contraction of 10.3% expected in 2026 (ECLAC). |
Sources: Dominican National Council of Free Zones (2024); Central Bank of the Dominican Republic (2025); IDB OVE (2021–2024 review); World Bank (2004); Jamaica Observer (October 2025); French Treasury (2020); ECLAC (August 2026).
The Dominican Republic built its growth on a steady inflow of private capital into the free zones, which employed 198,552 people and exported $8.4 billion in 2024 (National Council of Free Zones), and into tourism, which grew from 1.8 million arrivals in 1995 to 11.2 million visitors and $10.97 billion in receipts in 2024 (Central Bank of the Dominican Republic), all supported by inflation kept below target since 2012. Its domestic productivity nonetheless remains modest: of the 4.9% annual growth recorded between 2013 and 2023, it contributed only 0.4 points, the rest coming from investment that rose from 20 to 25% of GDP (Inter-American Development Bank, OVE, 2021–2024 review). Its momentum rests on a massive and uninterrupted accumulation of capital rather than on a technological leap.
Jamaica illustrates the role of macroeconomic discipline. With the IMF agreement of May 2013 and a monitoring committee on which employers and unions sit, it brought its debt down from 147% of GDP in 2012 to 62% in 2025. That discipline made it resilient: struck on 28 October 2025 by Hurricane Melissa, which caused damage and losses equivalent to 56.7% of its GDP (Planning Institute of Jamaica and ECLAC, March 2026), it contracted by only 1.7% over the fiscal year (Independent Fiscal Commission, June 2026). Crime, however, which costs at least 4% of GDP, and the departure of 80% of its university graduates, both noted by the World Bank as early as 2004, continue to hold back its growth: since 1990, its income per capita has risen by only 0.7% a year (Table 1).
Cuba, finally, shows that a high level of education is not enough to guarantee prosperity. Despite 10.6 years of average schooling and a life expectancy of 78 years, the island is living through the simultaneous collapse of its three engines in 2026: no more deliveries of Venezuelan oil since the capture of Nicolás Maduro by US forces on 3 January 2026, tourism down 48% in the first quarter, at least six nationwide blackouts during the year, and a population that fell from 10.06 to 9.75 million in a single year according to the Cuban statistics office. ECLAC forecasts a 10.3% fall in GDP in 2026 (20 August 2026).
What carried Haiti, and what let it down
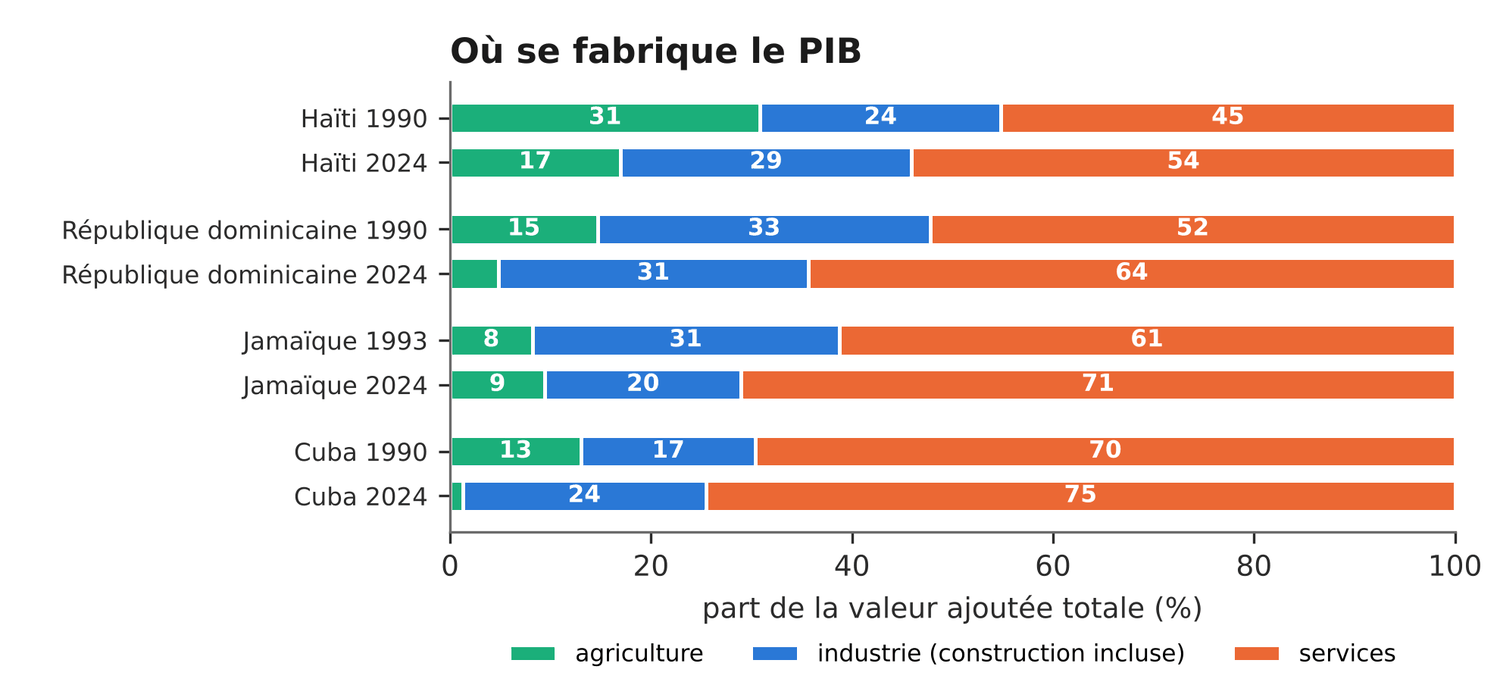
In thirty years, the Haitian economy has changed its nature without gaining strength. Agriculture accounted for 30% of GDP in 1990 and 17% in 2024, but still employs 45% of the workforce; its output has fallen by 25.7% since fiscal year 2018, and the Francisque mango lost the US market in October 2022 (World Bank, September 2026). Services took its place, fed by the telephone, with Digicel’s arrival in 2006 lifting mobile subscriptions from 5.5 per 100 inhabitants in 2005 to 70 in 2013, and above all by the diaspora, whose remittances rose from 8.5% of GDP in 2000 to 22.5% in 2020, with a record $4.4 billion in fiscal year 2025.
Industry had only one real engine: garment assembly for the US market, duty-free thanks to the HOPE (2006), HOPE II (2008), and HELP (2010) Acts. Sales to the United States climbed from $231 million in 2001 to $994 million in 2021, then fell back to $522 million in 2025, and employment from 58,500 people to 24,300 (World Bank, September 2026). The regime, which expired on 30 September 2025, was restored and then extended to 31 December 2028 by the law signed on 2 September 2026. The rest was construction for the two externally financed reconstructions: investment reached 26.5% of GDP between 1995 and 1999 and 25% in 2010, before falling to 12% in 2024. Haiti has thus known recoveries, never a lasting acceleration: none lasted more than five years or exceeded 2.4% a year per capita.
What could upset these calculations
The limits set out at the start are not a formal precaution: they leave the future open. Growth does not advance in a straight line; it moves in leaps. Hausmann, Pritchett, and Rodrik (2005) identified 83 growth accelerations around the world between 1957 and 1992: a country had roughly a one-in-four chance of experiencing one in any given decade, and these leaps often followed a major political change, far more rarely an isolated reform. Georgia grew by 9.3% a year from 2004 to 2007 after rebuilding its police and its tax administration; Rwanda sustained 7 to 8% a year from 2000 to 2019 (French Development Agency, 2021); Ethiopia, nearly 10% a year from 2004 to 2019 (IMF). No catch-up model had foreseen these trajectories.
The 2% speed assumed here is itself an average. Estimates that follow countries over time find speeds of 4 to 10% a year (Islam, 1995; Caselli, Esquivel, and Lefort, 1996). At 5%, in the third case described above, Haiti would catch up with Jamaica around 2041 rather than in 2055. A profound change in governance would act precisely where most of the gap lies: on the share that comes down to productivity, that is, on the ceiling itself. The model can measure that ceiling; it cannot say when a country decides to raise it.
Artificial intelligence may be one of these leaps. The World Bank’s World Development Report 2026, published on 4 August 2026 and devoted to artificial intelligence, estimates that 16.2% of jobs in developing economies could see their productivity significantly raised. It stresses simple, low-cost tools adapted to local conditions: the nurse who reaches a diagnosis faster, the teacher who prepares a lesson better, the farmer who chooses when to sow, the tax administration that audits more effectively. Its chief economist, Indermit Gill, goes so far as to speak of “a century of development in a decade” for countries that close their gaps in electricity, connectivity, and skills in time. Haiti has leapfrogged a stage once before: it spread the mobile phone, from 5.5 to 70 subscriptions per 100 inhabitants between 2005 and 2013, without ever having spread the landline. But in 2024, only 54% of Haitians had access to electricity and 48% used the internet (World Bank). The same report warns that artificial intelligence can also deepen inequality, spread disinformation, and serve political repression.
These breaks do not make the calculation useless; they change its starting data. The calculation says what it would take for them to count: a pace close to 5% a year, sustained for a generation.
Six courses of action to spark a turnaround
To set catch-up in motion, Haiti can draw on successful experiences in countries that overcame situations of extreme fragility or emerged from conflict.
Table 4. Six levers and the models that inspire them
| Area | International experience | Practical application for Haiti |
|---|---|---|
| Targeted security | El Salvador: homicides down from 106 to 1.9 per 100,000 (2015–2024). Medellín: restoration of order followed by public facilities. | Security force brought up to full strength (1,500 out of 5,500 at the end of September 2026) and urban investment in retaken neighborhoods. |
| Market access | Cambodia: 1999 textile agreement tied to labor standards verified by the ILO; exports up fivefold (2004–2024). | Refinancing of Better Work Haiti and a ten-year HOPE/HELP preference beyond 2028. |
| Economic corridors | Mauritius: 1970 free zone. | Energy, customs, and security concentrated on the North and South corridors (port of Cap-Haïtien, northern industrial parks). |
| Diaspora savings | Israel and India: $35 to $40 billion in diaspora bonds. Mexico: 3x1 program. | Guaranteed savings securities for the diaspora and a cut in remittance costs from 4.70% toward 3%. |
| Land and agriculture | Rwanda: 10.3 million plots registered at about $6 each. Vietnam: land entrusted to households (1988). | Land titling in the irrigated plains and a guarantee fund for rural credit. |
| Fiscal discipline | Georgia: revenues up from 12 to 26% of GDP (2003–2007). Jamaica: public monitoring committee (2013). | Broadening of the tax base (4.8% of GDP today) and a joint budget monitoring committee. |
Sources: World Bank (2012, 2026); Cerdá et al. (2012); IDE-JETRO (2012); USTR (2025); Ketkar and Ratha (2007); Ali, Deininger, and Goldstein (2014); Al Jazeera (29 September 2026).
The first lever concerns security, the precondition for any investment. El Salvador brought its homicide rate down from 106 per 100,000 inhabitants in 2015 to 1.9 in 2024, at the cost of more than 81,000 detentions and 261 deaths in custody documented by the organization Cristosal in 2024. Medellín took another path: retaking neighborhoods, then following up with cable cars, libraries, and schools, with a decline in homicides 66% greater in the neighborhoods served (Cerdá et al., American Journal of Epidemiology, 2012). The lesson is that neutralizing armed groups must go hand in hand, immediately, with a social presence of the state. In Haiti, the Gang Suppression Force (GSF) had about 1,500 troops at the end of September 2026 out of 5,500 authorized, and the elections scheduled for 13 December 2026 were postponed indefinitely on 6 October.
The second axis rests on making the most of our access to markets. The 1999 textile agreement between the United States and Cambodia granted larger quotas to factories whose compliance with labor law was verified by the ILO; Cambodian garment exports multiplied fivefold between 2004 and 2024. Haiti has the same tool, Better Work Haiti, which has been without US funding since 27 March 2025 (USTR, HOPE II report 2025). It must be refinanced together with the buyers, and a ten-year preference beyond 2028 must be negotiated now.
The third priority is to promote economic corridors. Mauritius, which the economist James Meade judged doomed in 1961, built its growth on a free zone created in 1970. Rather than waiting for an overall resolution of the capital’s problems, the country would do well to concentrate energy, customs services, and security on the North and South corridors proposed by the World Bank (September 2026), around the port of Cap-Haïtien and the northern industrial parks, which sustain about 16,000 jobs.
The fourth lever seeks to change the nature of the diaspora’s financial flows. Israel and India raised $35 to $40 billion through bonds sold to their emigrants (Ketkar and Ratha, World Bank, 2007); Mexico adds three public dollars to every dollar that migrant associations send for a local project. Haiti receives $4.4 billion a year, and each transfer from the United States costs 4.70% (World Bank, third quarter of 2025) against a global target of 3%. A tenth of these flows channeled into a guaranteed investment would amount to $440 million a year, more than donor aid, which fell to 1.2% of GDP in fiscal year 2025.
The fifth area of action targets the countryside. Rwanda registered all of its 10.3 million plots for about $6 a plot, and titled farmers invested more in their land (Ali, Deininger, and Goldstein, Journal of Development Economics, 2014); Vietnam entrusted land to households in 1988 and was exporting rice before the decade was out. In Haiti, a simple digital land registry in the irrigated plains, a guarantee fund for agricultural credit, and the restoration of sanitary inspection for mango exports would revive production and reopen markets.
Finally, overhauling public finances is the sixth pillar. Georgia raised its tax revenues from 12% of GDP in 2003 to 26% in 2007 (World Bank, 2012). With revenues of barely 4.8% of GDP and education spending of 0.96% of GDP in 2023, against 3.8% in the Dominican Republic, the Haitian state must modernize its tax administration and, within the IMF staff-monitored program extended to June 2027, set up a joint committee to monitor public spending, as Jamaica did in 2013.
Conclusion: when does the clock start?
If a child is born today in a Haiti capable of setting off sustained growth of 5% a year per capita, that child could see the country reach the standard of living of Jamaica and Cuba before turning forty, and sooner still if a political or technological break speeds things up. The historic gap with the Dominican Republic would then at last begin to narrow visibly.
If, on the other hand, the nation keeps to the trends of the past thirty years, the divide with our neighbors will go on widening.
The difference between these two futures depends not primarily on financial promises from abroad, but on choices about how the country organizes itself. The World Bank’s World Development Report 2011 measured the time the twenty fastest countries took to emerge from fragility: 17 years to get the army out of politics, 20 years for a functioning administration, 27 years to contain corruption. But none of the countries cited here waited for security and stability to be achieved before starting: Bangladesh signed with Daewoo in 1978, Rwanda launched its washed-coffee sector in 2002 with two stations, Jamaica signed its fiscal pact in 2013. The catch-up clock starts with a first decision that is measurable and kept. Haiti has two in front of it: a security force to bring up to full strength, and an election to schedule and to hold.
That leaves the question that decides all the others: who will take these decisions, and stick to them long enough for them to count? None of the countries cited accelerated without a government that had both a mandate and a time horizon. Georgia launched its reforms in the immediate aftermath of the presidential election of January 2004; Jamaica tied its recovery to a pact signed by the government, the opposition, employers, and unions, which survived changes in power. Haiti has had no elected officials at all since January 2023, and each transition inherits projects it has neither the time nor the legitimacy to see through. The first lever of catch-up is therefore political: to give the country elected leaders again, and to bind them, along with those who will succeed them, through a shared ten-year commitment precise enough to be checked every year.
Mathematical appendix: the catch-up model
A1. Production function and steady state
Output Y follows a Cobb-Douglas function with labor-augmenting technical progress:
where K is physical capital, L employment, h human capital per worker, and A total factor productivity. Per unit of effective labor, k = K/(AhL) and y = Y/(AhL) = kα, and capital accumulates according to:
where s is the investment rate, n population growth, g technical progress, and δ the depreciation of capital. In the steady state (dk/dt = 0), output per worker is:
With the conventional capital share α = 1/3, the exponent equals 0.5: doubling the investment rate multiplies long-run income by only 1.41. Productivity A and human capital h, by contrast, act with an exponent equal to 1.
A2. Speed of convergence
Linearizing the accumulation equation around the steady state, income per capita obeys:
In the augmented model of Mankiw, Romer, and Weil (1992), λ = (1 - α - β)(n + g + δ). With α = β = 1/3 and g + δ = 0.05: for Haiti, λ = (1/3)(0.0127 + 0.05) = 2.09% a year, a half-life of 33 years; for the Dominican Republic, λ = 2.01% a year, a half-life of 34.5 years. Empirical estimates bracket this value: 1.84% for 98 countries in Barro and Sala-i-Martin (1992), 1.37% in Mankiw, Romer, and Weil (1992), 1.7 to 2.4% in Barro (2012), 4.6 to 9.3% in the panel estimates of Islam (1995), and about 10% in Caselli, Esquivel, and Lefort (1996). With λ = 5%, ceiling 3 catches up with Cuba in 2037 and Jamaica in 2041, and ceiling 2 catches up with Cuba in 2046 and Jamaica in 2052.
A3. Catch-up time at constant growth rates
For two countries whose incomes grow each year at the constant rates gH and gX, that is, y(t) = y(0)(1 + g)t, the crossing time is:
All the rates cited in the text, in Table 2, and in Figure 2 are average annual rates of this kind, including the neighbors’ trends, calculated over 1990–2024.
2024 ratios: 8.70 (Dominican Republic), 4.07 (Jamaica), 3.00 (Cuba); logarithms 2.164, 1.405, and 1.099. Neighbors’ 1990–2024 trends: 3.58%, 0.72%, and 1.18%.
A4. Accounting decomposition of the gap (Hall and Jones, 1999)
Rewriting the production function in the form y = A h (K/Y)α/(1−α), the income ratio between Haiti (H) and a neighbor (D) breaks down into three multiplicative factors:
The long-run capital-output ratio equals s/(n + g + δ). Human capital is h = exp φ(S), where S is the average number of years of schooling and φ the Penn World Tables function (a return of 13.4% per year up to 4 years, 10.1% from 4 to 8 years, 6.8% beyond; Psacharopoulos 1994).
Table A1. Calibration parameters
| Parameter | Haiti | Dominican Republic | Jamaica | Cuba | Source |
|---|---|---|---|---|---|
| Investment rate s (2015–2024 average, % of GDP) | 16.3 | 25.7 | 19.0 | 15.0 | World Bank NE.GDI.TOTL.ZS; Jamaica: Penn World Table 11.0, 2014–2023 |
| Population growth n (2015–2024 average, %) | 1.27 | 1.02 | 0.16 | -0.27 | World Bank SP.POP.GROW |
| Average years of schooling S (2023) | 5.4 | 9.4 | 10.0 | 10.6 | UNDP, HDR 2025, table 1 |
| Human capital h = exp φ(S) | 1.97 | 2.82 | 2.93 | 3.06 | PWT function (Psacharopoulos 1994; Caselli 2005) |
| Long-run capital-output ratio s/(n+g+δ) | 2.61 | 4.27 | 3.68 | 3.18 | Calculation, g + δ = 0.05 (MRW 1992) |
| Speed of convergence λ = (1-α-β)(n+g+δ), % a year | 2.09 | 2.01 | 1.72 | 1.58 | Calculation, α = β = 1/3 |
| Half-life ln 2 / λ, years | 33 | 34.5 | 40 | 44 | Calculation |
| GDP per capita 2024, $ PPP 2021 | 2,784 | 24,230 | 11,340 | 8,356 | World Bank; Cuba: UNDP, extended by one year |
For the Dominican Republic: yH / yD = 0.115 = 0.781 (capital) × 0.699 (education) × 0.210 (productivity). In logarithms, 2.164 = 0.248 + 0.358 + 1.558, that is, 11%, 17%, and 72% of the gap. For Jamaica: 0.245 = 0.841 × 0.671 × 0.435, that is, 12%, 28%, and 59%. Because productivity is obtained as a residual, it lumps together everything that measured capital and schooling do not explain: institutions, security, infrastructure, but also the quality of teaching and measurement error. It remains, by far, the largest share of the gap.
A5. Three ceilings for Haiti
The trajectories in Figure 3 set the ceiling y* and then apply A2 with λ = 2.09% and g = 2%:
The rates g and λ in this equation are instantaneous rates; the rates below are converted into annual rates, as in the text. Ceiling 1, investment and schooling at the Dominican level: y* = 2,784 / (0.781 × 0.699) = $5,096, initial growth 3.3% a year. Ceiling 2, Jamaica’s current level: $11,340, initial growth 5.1%, averaging 4.4% over twenty-five years. Ceiling 3, the Dominican Republic’s current level: $24,230, initial growth 6.7%, averaging 5.7% over twenty-five years. In all three cases, 42% of the initial gap is closed by 2050, 66% by 2075, and 80% by 2100. Neighbors growing at a constant annual rate: Dominican Republic 2.5% (2019–2024 pace), Jamaica 0.72%, Cuba 1.18%. Crossing dates: ceiling 1, Jamaica in 2097 and Cuba in 2099; ceiling 2, Cuba in 2063 and Jamaica in 2068; ceiling 3, Cuba in 2050, Jamaica in 2055, and a ratio of 2.6 to the Dominican Republic in 2075.
A6. Data
World Bank, World Development Indicators (17 October 2026): GDP per capita at PPP (constant 2021 dollars), growth, gross capital formation, population growth, remittances, sectoral structure. Jamaica’s investment rate: Penn World Table 11.0 (2014–2023 average), since the World Bank does not publish this series. Schooling: UNDP, Human Development Report 2025, table 1. Cuba: UNDP gross national income per capita for 2023 ($8,415 at 2021 PPP), extended and backcast using the change in GDP per capita in Cuba’s national accounts; the 2023 Maddison database places Cuba higher, at 4.9 times the Haitian level in 2022, which would lengthen Cuba’s catch-up times by about 45%.
Sources cited
Statistical data
- World Bank, World Development Indicators, retrieved on 17 October 2026 (GDP per capita, growth, investment, population, remittances, sectoral structure, mobile subscriptions, access to electricity, internet use, education spending, official aid).
- UNDP, Human Development Report 2025, statistical annex, table 1.
- Bolt, J., van Zanden, J. L., Maddison Project, 2023 database, via Our World in Data.
- Feenstra, R., Inklaar, R., Timmer, M., Penn World Table 11.0, via FRED.
- IMF, World Economic Outlook, DataMapper database (growth in Ethiopia, 2004–2019).
Institutional reports and documents
- World Bank (September 2026), Haiti: Pathways to Growth Amid Rising Risks; Haiti country page (7 October 2026); Macro Poverty Outlook Haiti (April 2026); Haiti Human Capital Index Plus (2026).
- World Bank (4 August 2026), World Development Report 2026, The Promise of Artificial Intelligence, consulted through its presentation by Engineering News and Reuters (4 August 2026).
- World Bank (2011), World Development Report 2011: Conflict, Security, and Development.
- World Bank (2012), Fighting Corruption in Public Services: Chronicling Georgia’s Reforms.
- World Bank (2004), Jamaica: The Road to Sustained Growth, country economic memorandum, report 29101.
- World Bank, Remittance Prices Worldwide, United States to Haiti corridor (third quarter of 2025).
- Inter-American Development Bank, Office of Evaluation and Oversight (OVE), Independent Country Program Review: Dominican Republic 2021-2024.
- Cicowiez, M., Filippo, A. (2018), A Simple Stylized Long-Run Growth Model for Haiti, Inter-American Development Bank, technical note IDB-TN-1485.
- Banco Central de la República Dominicana, results of the Dominican economy for 2024 (27 January 2025).
- Consejo Nacional de Zonas Francas de Exportación, 2024 statistical report, as presented by Revista Mercado (30 August 2025).
- ECLAC, Estudio Económico de América Latina y el Caribe 2026 (20 August 2026).
- Planning Institute of Jamaica and ECLAC, damage and loss assessment of Hurricane Melissa (March 2026).
- Independent Fiscal Commission (Jamaica), statement of 3 June 2026, reported by The Gleaner.
- Ministry of Finance of Jamaica, Interim Fiscal Policy Paper FY2025/26.
- Eichengreen, B., Arslanalp, S., Henry, P. B. (March 2026), “Debt Reduction: Lessons from Jamaica,” IMF, Finance and Development.
- Direction générale du Trésor (France), “Cuba: l’exportation de services médicaux” (16 April 2020).
- United Nations Panel of Experts on Haiti, final report S/2025/356 (10 June 2025).
- USTR, Haiti HOPE II Report to Congress 2025.
- United States International Trade Commission (USITC), apparel imports from Haiti, 2001–2021 (December 2022).
- The White House, signing into law of H.R. 6500, Continuing Appropriations and Extensions Act, 2027 (2 September 2026).
- Porte, M. (2021), Rwanda: an effective development model, rising to the challenge of its sustainability, French Development Agency, Macroéconomie et développement No. 32.
- UK Department for International Development (2014), Rwanda Land Tenure Regularisation: case study.
- Subramanian, A., Roy, D. (2001), “Who Can Explain the Mauritian Miracle? Meade, Romer, Sachs, or Rodrik?” IMF, Working Paper WP/01/116.
- Asuyama, Y., Neou, S. (2012), “How Has the Cambodian Garment Industry Evolved?” IDE-JETRO.
- Ketkar, S., Ratha, D. (2007), “Development Finance via Diaspora Bonds: Track Record and Potential,” World Bank, Policy Research Working Paper 4311.
- Human Rights Watch (8 December 2024), World Report 2025, El Salvador chapter, which draws on figures from the organization Cristosal.
Academic studies
- Ali, D. A., Deininger, K., Goldstein, M. (2014), “Environmental and gender impacts of land tenure regularization in Africa: Pilot evidence from Rwanda,” Journal of Development Economics, 110.
- Aparicio, F. J., Meseguer, C. (2012), “Collective Remittances and the State: The 3x1 Program in Mexican Municipalities,” World Development, 40(1).
- Barro, R. J., Sala-i-Martin, X. (1992), “Convergence,” Journal of Political Economy, 100(2).
- Barro, R. J. (2012), “Convergence and Modernization Revisited,” NBER, Working Paper 18295.
- Caselli, F., Esquivel, G., Lefort, F. (1996), “Reopening the Convergence Debate: A New Look at Cross-Country Growth Empirics,” Journal of Economic Growth, 1(3).
- Cerdá, M. et al. (2012), “Reducing Violence by Transforming Neighborhoods: A Natural Experiment in Medellín, Colombia,” American Journal of Epidemiology, 175(10).
- Easterly, W., Reshef, A. (2010), “African Export Successes: Surprises, Stylized Facts, and Explanations,” NBER, Working Paper 16597.
- Hall, R. E., Jones, C. I. (1999), “Why Do Some Countries Produce So Much More Output per Worker than Others?” Quarterly Journal of Economics, 114(1).
- Hausmann, R., Pritchett, L., Rodrik, D. (2005), “Growth Accelerations,” Journal of Economic Growth, 10(4).
- Islam, N. (1995), “Growth Empirics: A Panel Data Approach,” Quarterly Journal of Economics, 110(4).
- Mankiw, N. G., Romer, D., Weil, D. N. (1992), “A Contribution to the Empirics of Economic Growth,” Quarterly Journal of Economics, 107(2).
- Psacharopoulos, G. (1994), “Returns to Investment in Education: A Global Update,” World Development, 22(9).
- Solow, R. M. (1956), “A Contribution to the Theory of Economic Growth,” Quarterly Journal of Economics, 70(1); Swan, T. W. (1956), “Economic Growth and Capital Accumulation,” Economic Record, 32(2).
Press
- Le Nouvelliste (3 September 2026), extension of HOPE/HELP to 2028.
- GHY International (9 February 2026), retroactive restoration of HOPE/HELP.
- Le National (6 October 2026), postponement of the general elections.
- Al Jazeera (29 September 2026), extension of the Gang Suppression Force’s mandate; Associated Press and Al Jazeera (10 January 2023), expiry of the terms of Haiti’s last senators.
- Jamaica Observer (10 October 2025), employment in outsourced services.
- The Daily Star (Bangladesh), “Desh Garments: a pioneer’s gift to his country.”
- Sustainable Harvest (26 April 2021), coffee washing stations in Rwanda.
- USNI News (3 January 2026), capture of Nicolás Maduro; Reuters, carried by BNN Bloomberg (13 January 2026), Venezuelan oil deliveries to Cuba; Cubanet, citing ONEI (first-quarter 2026 tourism); Diario de Cuba (21 February 2025), population as of 31 December 2024 according to ONEI; Emol (18 September 2026), nationwide blackouts.